What Rowing Strategy Has Better Catch Timings - Following Stroke Seat Or The Person Ahead Of You?
Using math to answer a question where math shouldn't be involved
Written by latentCall145 on September 13, 2024 (changelog)
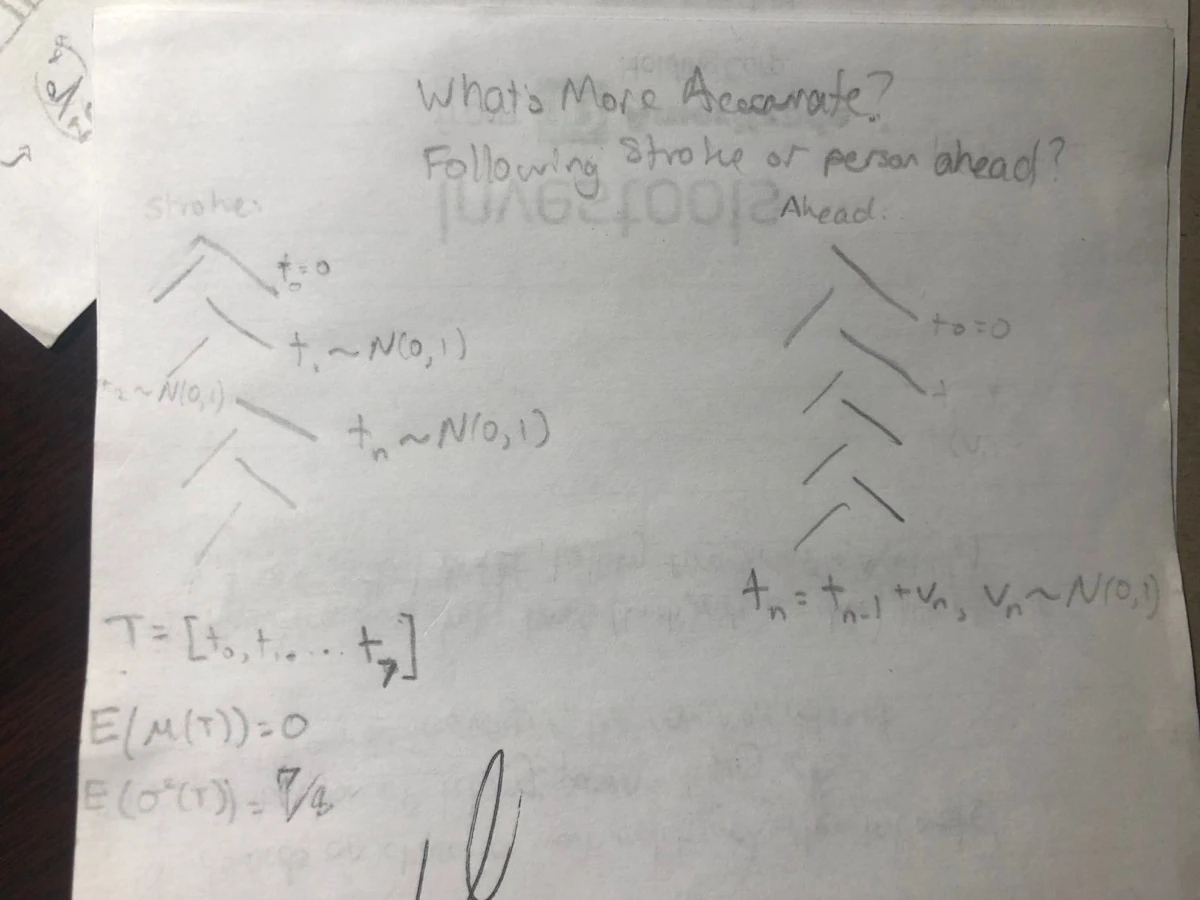
Diagram of the random variables present when following stroke seat's catch vs. following the person ahead of you
Context
I was a rowing coxswain in high school, AKA the small person in the boat yelling at the rowers to row. This article has to do with rowing, not coxing, but I was initially invested in this topic because everyone in the boat - rowers and coxswains - wanted to do anything to be faster on the water. One easy way to be faster?
Make sure everyone's rowing at the same time.
Sounds straightforward but it can take crews years to build the muscle memory to start pulling their blade through the water (called the catch) perfectly in sync with the rest of the boat. So there's reason to wonder if there are some tricks to make everyone row as synced as possible. One day, I was thinking about this problem and I thought of two different strategies to maintain a boat's sync:
- Following stroke seat: The rower in the stroke seat (who is aptly called the stroke seat) sets the boat's rhythm. They're ahead of all other rowers which makes their oar visible to all rowers behind them.
- Following the person ahead of you: Just because any rower can see the stroke seat's oar doesn't mean it's easy. Not only that, you can't see the body movement of the stroke seat unless you're directly behind them. But you can see the body movement of the person in front of you!
The best way to determine which strategy is better is to ask a rowing coach about it. But I decided not to because:
- I already graduated high school when I thought of this question
- I saw a way to turn the question of "Which strategy has better sync" into an interesting math question
Ok, it's pretty easy to determine which strategy results in better catch timing. It's following the stroke seat. Let's say you're behind someone who made an egregiously late catch relative to the stroke seat. If you were to follow the person ahead of you, now two people in the boat made an egregiously late catch relative to the stroke seat. But how much worse is the rower-ahead strategy compared to the stroke seat strategy?
Math
Now is the section where I make a ton of assumptions about our circumstances that have little to no practical meaning to rowing. But here we go.
Some formulas you need to know (some formulas use N; N = num elements in X):
\begin{align} \sum_{i=1}^{n} i &= \frac{n(n+1)}{2} \\ \sum_{i=1}^{n} i^2 &= \frac{n(n+1)(2n+1)}{6} \\ \mu_X &= \frac{1}{N} \sum_{x \in X} x \\ \sigma^2(X) &= \frac{1}{N} \sum_{x \in X} (x - \mu)^2 \\ \end{align}Let's define some terms. $n$ is the number of rowers in a boat. For a given stroke, let's call $t_i$ the catch timing (relative to stroke seat) of the $i$-th rower behind the stroke seat. For a boat with $n$ rowers, $i=0$ represents the stroke seat, $i=1$ is the rower right behind the stroke seat, and so on until $i=n-1$, which represents the rower farthest behind the stroke seat. Likewise, $T_i$ is the random variable associated with the $i$-th rower ($t_i$ is a sampled value from $T_i$).
Hold on... what's a random variable?
Say you have a process that is random like a dice roll. A random variable is a characteristic associated with this process, such as the result of said dice roll. Random variables don't have defined values - you can't just say what the result is for all possible flips. Instead, we can pull a sample from a random variable. For the dice roll, a sample would be rolling the dice and seeing what comes up. What's good about random variables is that we can pull an infinite number of samples from these variables and then calculate information about the random process as a whole. Notation-wise, if a term describes something random and it's capitalized, it's a random variable. If it's not, it's a sample. The reason I'm stressing this is because certain operations only make sense on random variables and not samples, such as the expected value operator, which I'll explain two paragraphs from now.
For both scenarios, the catch timing of the stroke seat is $t_0 = 0$, which has some connection to rowing as the stroke seat's rhythm is assumed to be the correct rhythm for the boat. If $t_i > 0$, then that rower started their catch later than the stroke seat, and $t_i < 0$ means an early catch. For a given stroke, the mean (Equation 3, abbreviated as E3) of $t_0,...,t_{n-1}$ will be denoted as $\bar{t}$ (whose random variable is $\bar{T}$). The last assumption I made is that the $i$-th rower (other than stroke seat) will have a catch timing offset $D_i$ in a bell curve with a mean of 0 and variance of 1, denoted as $D_i \sim \mathcal{N}(0, 1)$, relative to the person whose catch timing they're trying to copy. Enough terms, let's get to the math:
If we want to quantify the amount of spread in a boat's catch timing (where lower spread = better catch timing), the natural choice is to calculate the variance (E4) of the catch timings for a stroke. Let's call this idea the catch variance or $cv$ and $CV$ for the sample and random variable respectively. To be clear, $cv = \sigma^2(t_0, ..., t_{n-1}) = \frac{1}{n} \sum_{i=0}^{i=n-1} (t_i - \bar{t})^2$. And to compare the catch variance of different strategies, we don't just want to calculate the catch variance of a single stroke. We want to know about the average catch variance if we took an infinite number of strokes. This average operation is called the expected value, and we're running the expected value over CV, denoted as $\mathbb{E}[CV]$. The rest of this article is about finding this value for both strategies.
Stroke seat strategy
$T_0 = 0$, for $0 < i < n$ where $n$ is the number of rowers in the boat, $D_{i} \sim \mathcal{N}(0, 1)$, $T_i = T_0 + D_i$
We want to find the expected catch variance $\mathbb{E}[CV]$:
\begin{align} \mathbb{E}[CV] &= \mathbb{E}[\sigma^2(T_0,T_1,...,T_{n-1})] \\ &= \mathbb{E}[\frac{1}{n} \sum_{i=0}^{n-1} (T_i - \bar{T})^2] \\ &= \mathbb{E}[\frac{1}{n} \sum_{i=0}^{n-1} (T_i^2 -2 T_i \bar{T} + \bar{T}^2)] \\ &= \mathbb{E}[ \frac{1}{n} (\sum_{i=0}^{n-1} T_i^2) - \frac{1}{n} (\sum_{i=0}^{n-1} 2 T_i \bar{T}) + \frac{1}{n} (\sum_{i=0}^{n-1} \bar{T}^2) ] \\ &= \mathbb{E}[ \frac{1}{n} (\sum_{i=0}^{n-1} T_i^2) - \frac{2 \bar{T}}{n} (\sum_{i=0}^{n-1} T_i) + \frac{\bar{T}^2}{n} (\sum_{i=0}^{n-1} 1) ] \\ &= \mathbb{E}[ \frac{1}{n} (\sum_{i=0}^{n-1} T_i^2) - 2 \bar{T}^2 + \bar{T}^2 ] \\ &= \mathbb{E}[ \frac{1}{n} (\sum_{i=0}^{n-1} T_i^2) - \bar{T}^2 ] \\ &= \frac{1}{n} (\sum_{i=0}^{n-1} \mathbb{E}[T_i^2]) - \mathbb{E}[\bar{T}^2] \\ &= \frac{1}{n} (\sum_{i=1}^{n-1} \mathbb{E}[T_i^2]) - \mathbb{E}[\bar{T}^2] \\ \end{align}The only things I wanted to explain were E9 and E13. We got E9 by factoring out $\bar{T}$ and I initially thought we couldn't do this because I thought that I could only factor out constants from sums. Not even $\bar{t}$ is a constant, as it depends on the values of $t_0,...,t_{n-1}$. But you actually can factor non-constants out from a sum as long the value is constant relative to the index in the sum. $\sum_{i=0}^{n-1} 2 T_i \bar{T}$ equals $\sum_{i=0}^{n-1} 2 T_i (\sum_{j=0}^{n-1} T_j)$, and these $T_j$ terms don't change as $i$ changes in the $i$-sum, so $\bar{T}$ is fair game to be factored out from the $i$-sum. And then for E13, since $T_0 = 0$, that means $\mathbb{E}[T_0] = 0$ so I started the sum at $i=1$ instead of $i=0$.
Now let's find $\mathbb{E}[T_i^2]$. There's another definition for variance that would be helpful to know: $\sigma^2(X) = E[X^2] - E[X]^2$. This means $E[X^2] = \sigma^2(X) + E[X]^2 = \sigma^2(X) + \mu_X^2$. Since $T_i$ are normally distributed with $\mu = 0, \sigma^2 = 1$:
\begin{align} E[T_i^2] &= 1 + 0^2 \\ E[T_i^2] &= 1 \end{align}$\mathbb{E}[\bar{T}^2]$ is harder to find but not super hard:
\begin{align} \mathbb{E}[\bar{T}^2] &= \mathbb{E}[(\frac{1}{n} \sum_{i=1}^{n-1} T_i)^2] \\ &= \frac{1}{n^2} \mathbb{E}[(\sum_{i=1}^{n-1} T_i)^2] \\ &= \frac{1}{n^2} \mathbb{E}[\sum_{i=1}^{n-1} \sum_{j=1}^{n-1} T_i T_j] \\ &= \frac{1}{n^2} \sum_{i=1}^{n-1} \sum_{j=1}^{n-1} \mathbb{E}[T_i T_j] \\ \end{align}Pause. The value of $T_i$ does not affect $T_j$ if $i \ne j$ (since the $j$-th rower is just trying to copy the stroke seat, not the $i$-th rower). In math lingo, $T_i$ and $T_j$ are independent. If $X$ and $Y$ are independent, $\mathbb{E}[XY] = \mathbb{E}[X] \mathbb{E}[Y]$, and since $\mathbb{E}[T_i] = 0$ (again, these are normally distributed variables), $\mathbb{E}[T_i T_j] = 0$ if $i \ne j$. Resume.
\begin{align} \mathbb{E}[\bar{T}^2] &= \frac{1}{n^2} \sum_{i=1}^{n-1} \sum_{j=1}^{n-1} \mathbb{E}[T_i T_j] \\ &= \frac{1}{n^2} \sum_{i=1}^{n-1} \mathbb{E}[T_i^2] \\ &= \frac{1}{n^2} \sum_{i=1}^{n-1} 1 \\ &= \frac{n-1}{n^2} \\ \end{align}Putting E13, E15, and E23 together, we get our expected catch variance for rowers following the stroke seat:
\begin{align} \mathbb{E}[CV] &= \frac{1}{n}(\sum_{i=1}^{n-1} \mathbb{E}[T_i^2]) - \mathbb{E}[\bar{T}]^2 \\ &= \frac{1}{n}(\sum_{i=1}^{n-1} 1) - \frac{n-1}{n^2} \\ &= \frac{n-1}{n} - \frac{n-1}{n^2} \\ &= \frac{n(n-1) - (n-1)}{n^2} \\ \mathbb{E}[CV] &= (\frac{n-1}{n})^2 \\ \end{align}Rower-ahead strategy
$T_0 = 0$, for $0 < i < n$ where $n$ is the number of rowers in the boat, $D_{i} \sim \mathcal{N}(0, 1)$, $T_i = T_{i-1} + D_i = \sum_{j=1}^i D_i$.
If you look at E5-E13, you'll find that there are no special assumptions about what $T_i$ or $\bar{T}$ has to be (as opposed to E14-E15, which required $T_i$ must have a mean of 0 and a variance of 1), so E13 still applies and we'll start from there. Note that we still have to find $\mathbb{E}[T_i^2]$ and $\mathbb{E}[\bar{T}^2]$ for the modified $T_i$ definition, so let's start with finding $\mathbb{E}[T_i^2]$:
\begin{align} E[T_i^2] &= \sigma^2(T_i) + \mu_{T_i}^2 \\ &= \sigma^2(\sum_{j=1}^i D_i) + (\mathbb{E}[\sum_{j=1}^i D_i])^2 \\ &= \sum_{j=1}^i \sigma^2(D_i) + (\sum_{j=1}^i \mathbb{E}[D_i])^2 \\ &= \sum_{j=1}^i 1 + (\sum_{j=1}^i 0)^2 \\ &= i \\ \end{align}I was able to move the $\sigma^2$ inside the sum because there's a property that if $X,Y$ are independent variables, $\sigma^2(X + Y) = \sigma^2(X) + \sigma^2(Y)$. The random variable $D_i$ is independent of $D_j$ if $i \ne j$, so this property applies. Note how I didn't say $T_i$ is independent of $T_j$ because they are dependent; e.g. if rower 1 had a really late catch relative to stroke seat and rower 2 is following rower 1, rower 2 is likely to also have a late catch relative to stroke seat.
Now let's do $\mathbb{E}[\bar{T}^2]$, starting off from E19:
\begin{align} \mathbb{E}[\bar{T}^2] &= \frac{1}{n^2} \sum_{i=1}^{n-1} \sum_{j=1}^{n-1} \mathbb{E}[T_i T_j] \\ &= \frac{1}{n^2} \sum_{i=1}^{n-1} \sum_{j=1}^{n-1} \mathbb{E}[(\sum_{m=1}^i D_m)(\sum_{n=1}^j D_n)] \\ &= \frac{1}{n^2} \sum_{i=1}^{n-1} \sum_{j=1}^{n-1} \mathbb{E}[\sum_{m=1}^i \sum_{n=1}^j D_m D_n] \\ &= \frac{1}{n^2} \sum_{i=1}^{n-1} \sum_{j=1}^{n-1} \sum_{m=1}^i \sum_{n=1}^j \mathbb{E}[D_m D_n] \\ \end{align}Uh... yeah, I kinda forgot this article was about rowing. Anyway, four summations are kind of daunting, but they'll go away soon. We can make the connection that, besides some different variable names, $\mathbb{E}[D_m D_n]$ is the same expression as $\mathbb{E}[T_i T_j]$ for the stroke seat strategy since both expressions deal with the multiplication of two normally distributed variables. Because of this, we can reuse the follow-stroke result that $\mathbb{E}[T_i T_j] = \delta_{ij}$ (1 if $i = j$ and 0 otherwise) to this strategy. Concretely, $\mathbb{E}[D_m D_n] = \delta_{mn}$.
Since $\mathbb{E}[D_m D_n] = \delta_{mn}$, you can imagine $\sum_{m=1}^i \sum_{n=1}^j \mathbb{E}[D_m D_n]$ as the sum of a rectangle with $i$ rows and $j$ columns where the diagonal is filled with 1s and 0s everywhere else (see below).
![Expected values of D[m]*D[n]](assets/dm-dn.webp)
Expected values of $D_m D_n$ for i=3, j=5 as well as i=5, j=3 respectively. The number of yellow squares for each rectangle represents $\sum_{m=1}^i \sum_{n=1}^j \mathbb{E}[D_m D_n]$ for a specific $i,j$.
Therefore, the sum of this rectangle is the number of diagonal elements in this rectangle which is equal to the minimum of $i$ and $j$. So now we have
\[ \mathbb{E}[\bar{T}^2] = \frac{1}{n^2} \sum_{i=1}^{n-1} \sum_{j=1}^{n-1} \text{min}(i, j) \]Interestingly, we can express this as a sum of squares. Below is a 3D plot with $n-1$ rows and columns where the height of the $i$-th row and $j$-th column is equal to $\text{min}(i, j)$.
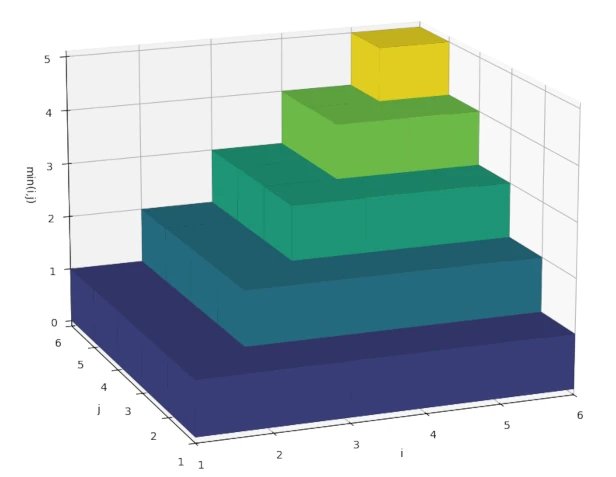
min(i, j) for n=6.
The sum of all heights represents $\sum_{i=1}^{n-1} \sum_{j=1}^{n-1} \text{min}(i, j)$. As you can see, the plot looks like we stacked up squares of height 1 with length $[1, n-1]$. Specifically, $\sum_{i=1}^{n-1} \sum_{j=1}^{n-1} \text{min}(i, j)$ looks like (and is equivalent to) $\sum_{k=1}^{n-1} k^2$. Resuming where we left off and using E2, we get:
\begin{align} \mathbb{E}[\bar{T}^2] &= \frac{1}{n^2} \sum_{i=1}^{n-1} \sum_{j=1}^{n-1} \text{min}(i, j) \\ &= \frac{1}{n^2} \sum_{k=1}^{n-1} k^2 \\ &= \frac{1}{n^2} \frac{n(n-1)(2n-1)}{6} \\ &= \frac{(n-1)(2n-1)}{6n} \\ \end{align}Combining E13, E33, and E41, as well as using E1, we get to our expected catch variance for rowers following the person ahead of them:
\begin{align} \mathbb{E}[CV] &= \frac{1}{n}(\sum_{i=1}^{n-1} \mathbb{E}[T_i^2]) - \mathbb{E}[\bar{T}]^2 \\ &= \frac{1}{n}(\sum_{i=1}^{n-1} i) - \frac{(n-1)(2n-1)}{6n} \\ &= \frac{1}{n} \frac{n(n-1)}{2} - \frac{(n-1)(2n-1)}{6n} \\ &= \frac{3n(n-1)}{6n} - \frac{(n-1)(2n-1)}{6n} \\ &= \frac{(n-1)(3n - (2n-1))}{6n} \\ &= \frac{(n-1)(n + 1)}{6n} \\ \mathbb{E}[CV] &= \frac{n^2 - 1}{6n} \\ \end{align}Expected catch variance TL;DR
Stroke seat strategy: $\mathbb{E}[CV] = (\frac{n-1}{n})^2$
Rower-ahead strategy: $\mathbb{E}[CV] = \frac{n^2 - 1}{6n}$
Testing out these equations
The most obvious question I had was wondering if these catch variance formulas were correct. Here's a script to simulate $\mathbb{E}[CV]$:
import matplotlib.pyplot as plt
import numpy as np

M = 10000000 # number of random trials to run
N = [1, 2, 4, 8, 24] # number of rowers
for n in N:
    d = np.random.randn(M, n)
    d[:, 0] = 0 # stroke seat t_i = 0
    follow_stroke_t = d # t_i for following stroke seat
    follow_ahead_t = np.cumsum(d, axis=1) # t_i for followiwing rower ahead
    stroke_cv = np.mean(np.var(follow_stroke_t, axis=1))
    ahead_cv = np.mean(np.var(follow_ahead_t, axis=1))
    print('Number of rowers:', n)
    print(f'  CV when following stroke seat')
    print(f'    theoretical: {((n-1)/n)**2:.5f}')
    print(f'    simulation:  {stroke_cv:.5f}')
    print(f'  CV when following rower ahead')
    print(f'    theoretical: {(n**2 - 1)/6/n:.5f}')
    print(f'    simulation:  {ahead_cv:.5f}')
Here are some results I got for $\mathbb{E}[CV]$ for the different strategies across different boat classes, rounded to 5 decimal places. We're expecting the simulated values to be very close to the theoretical ones:
| Number of Rowers | Stroke seat (theoretical) | Stroke seat (simulation) | Rower-ahead (theoretical) | Rower-ahead (simulation) |
|---|---|---|---|---|
| 1 (Single) | 0 | 0 | 0 | 0 |
| 2 (Double/Pair) | 0.25 | 0.25007 | 0.25 | 0.25007 |
| 4 (Quad/Four) | 0.5625 | 0.56252 | 0.625 | 0.62491 |
| 8 (Oct/Eight) | 0.76562 | 0.76566 | 1.3125 | 1.31188 |
| 24 (Stampfli) | 0.9184 | 0.91854 | 3.99306 | 3.99161 |
Indeed the simulated values are almost identical to the ones we just derived. Also, another interesting thing to know is that following the stroke seat always results in less expected catch variance compared to following the rower ahead if you have more than two rowers in the boat (for one or two rowers, the two strategies are identical). The difference between the strategies only grows the more rowers you put on a boat, as the stroke seat strategy formula is bounded above by 1 (i.e. $\lim_{n \longrightarrow \infty} (\frac{n-1}{n})^2 = 1$), while the rower-ahead strategy will forever grow at a rate of $\frac{1}{6}$ per added rower. Because more catch variance means worse overall catch timings, the math says that you should be following the stroke seat, not the rower ahead of you.
Conclusion
Rowing math and physics is fun. I remember when I thought of a weird physics question - for port-rigged eights, where does the boat turn if cox sculls stroke seat's oar - got a weird answer (it should turn to port), and being horrified when I tested it out on a real boat and was correct. This question was also fun to think about and it gave me a chance to use math I'd normally use for ML. For some context, I initially solved this problem about a year ago and got the correct final answers but made several mistakes. Between then and now, I caught up on some ML math (linear algebra, vector geometry, calculus, and probability), and the probability section turned out to be pretty helpful for this question. And uh, if you want better catch timings, follow stroke seat if possible, not the person ahead of you.
Changelog
- November 1, 2023: Made initial derivation (incorrect method but correct answer)
- September 13, 2024: Published this to my site
- March 12, 2025: Minor formatting changes
- March 14, 2025: Changed $\sum_{i=1}^{n-1} \sum_{j=1}^{n-1} \text{min}(i, j) = \sum_{k=1}^{n-1} k^2$ instead of $\sum_{i=1}^{n-1} i^2$ because $\sum_{i=1}^{n-1} \sum_{j=1}^{n-1} \text{min}(i, j) = \sum_{i=1}^{n-1} i^2$ implies that $\sum_{j=1}^{n-1} \text{min}(i, j) = i^2$ which is untrue